Infographic Design Trend Report
1. High-Level Infographic Design Insights - 10 Pages / 50 Examples
2. Infographic Design Case Studies - 20 Pages of Examples
Get a Custom Version of the Infographic Design Trend Report
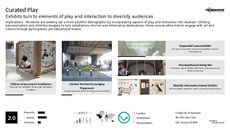
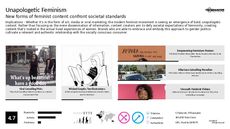
The Infographic Design Trend Report follows various infographic data visualization techniques, such as flow charts, as well as online design services that allows one to make an infographic. Our report features social media infographic trends such as a Facebook infographic which charts usage, infographic resume tools and other unique and captivating ways to visualize complex data.Who Custom Infographic Design Market Research is For
This particular trend report will benefit graphic and infographic designers, web programmers, journalists, software engineers and other online media professionals aiming to capitalize on emerging infographic trends. We will showcase new and emerging themes that are best represented through simplified visual charts. Use Trend Hunter’s Infographic Design Trend Report to better understand this new means of graphical data representation.Get Fast, Cost-Effective Custom Infographic Design Research
In as little as a day, a new Infographic Design Trend Report can be customized to your needs, which could include: presentations, graphic design, visual communication, social media, web design and infographic design trends. Other Sample Topics: Pop Cultural Fandom, News Coverage, TV, Blogging, Celebrity Marketing, Movie Memorabilia, GIF, Live Music, Newspaper, Luxury Cinema, Gen Y Consumer, Viral, Cartoon, Fan Culture, Infographic Design, Visual Media, Stop-Motion Animation, Music Festival, Commercial, Musical, [More]Sample Infographic Design Market Research Report
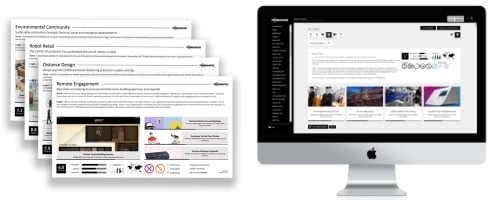
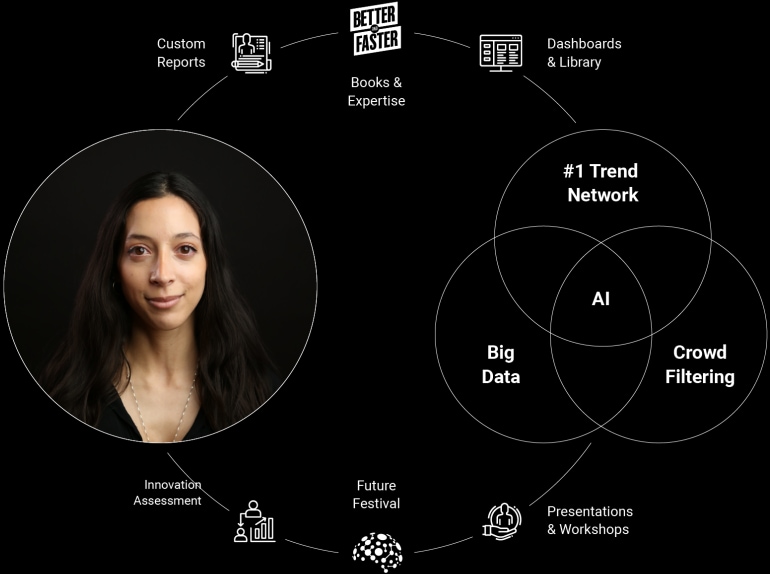
Our Infographic Design research includes hundreds of examples and Crowdsourced Consumer Insight®, hyperlinked to additional content on Trend Hunter, the world's #1 largest, most popular trend platform.
Here's why hundreds of the world's most powerful brands rely on our custom service...
Key Use Cases
• Inspire New Products & Services - Get custom reports on your topics• Predict, Monitor & Validate - Dive into consumer insights in your specific niche
• Track Key Segments - Monitor markets, competitors, opportunities & threats
• Improve Projects - Enhance pitches, campaigns, launches and specific tactics
• Save Time, Effort & Money - Get inspiring, visual presentations for your meetings
Market Research Methodology
Step 1. You contact us to let us know your needs.
Step 2. Your dedicated researcher begins by consulting with you on the topic goals, desired depth, breadth and style of report or presentation you require.
Step 3. We start researching using the world's #1 trend report platform. With specialized tools, over 300,000 ideas and insight from 100,000,000 people, we extract 95% of the steps and costs associated with custom research. Your 50 - 100 page PowerPoint trend report can be created in as little as a day (although a week is ideal).
Need More? If you want to convert trend report insights into action, ask about our Innovation Accelerator run by our CEO, a NY Times Bestselling strategist and top keynote speaker on innovation.
Why wait? contact us now.
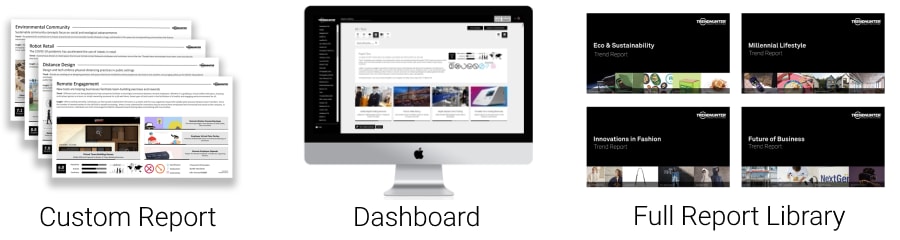
BONUS: Full Access to Our Trend Report Library
- 80+ categories of premium trend reports
- 331 pages of Consumer Insights from this year with 1,461 examples
- 10,998+ pages of Consumer Insights in the full archive with 62,653 examples
- Includes reports in: marketing, lifestyle, technology, culture, luxury, design, fashion, eco and more.
- Special tools and premium access to the world's #1 trend platform, updated hourly